2026-10-24
Taipei, New Taipei, Yilan Restaurants: New Registrations, Ratings
Based on the Javelin data version of 24 October 2026. Javelin is my own restaurant intelligence and trade-area platform, combining Ministry of Finance business-tax records, Google Maps and 50+ other official and public sources. Author: Jason Tsai, see About.
The short answer
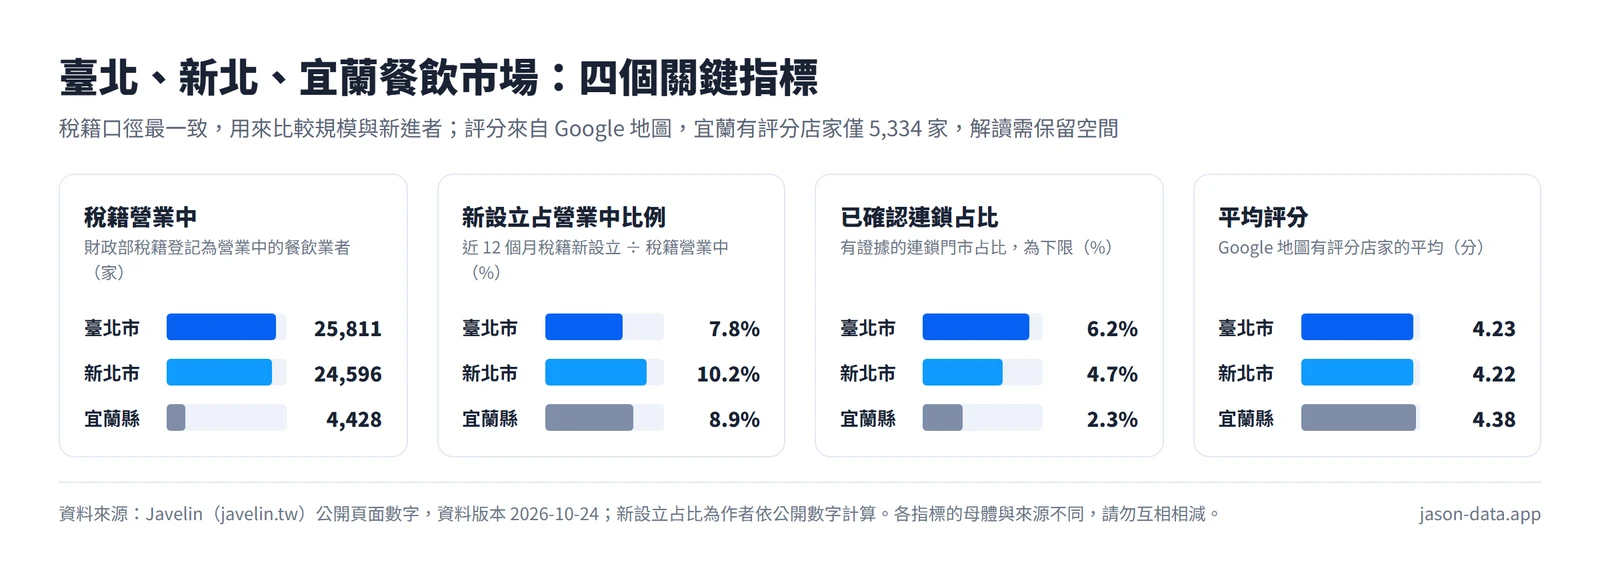
A note on basis first: the figures here come from three different bases (Ministry of Finance tax records, Javelin-confirmed chains, Google Maps) and cannot be subtracted from each other. Among the three, Taipei has the most tax-registered operating restaurants (25,811 records), then New Taipei (24,596) and Yilan (4,428). The order changes for newcomers: over the last 12 months (2025-11 to 2026-10) New Taipei registered 2,515, about 25% more than Taipei's 2,020. As a share of operating venues, New Taipei is 10.2%, Yilan 8.9% and Taipei 7.8%. Yilan has the highest average rating (4.38), and Taipei the highest confirmed chain share (lower bound), 6.2%.
Key comparison
Javelin tracks 71,318 restaurants across the three (Google Maps listings not permanently closed, including temporarily closed ones). The metrics below come from three different bases and should not be mixed.
Tax records (Ministry of Finance)
- Operating in tax records: Taipei 25,811, New Taipei 24,596, Yilan 4,428 records (per Javelin's definition this includes delivery-only and stall businesses)
- New tax registrations in the last 12 months (excluding closed): Taipei 2,020, New Taipei 2,515, Yilan 392
- Share of operating venues that are new: Taipei 7.8%, New Taipei 10.2%, Yilan 8.9% (my calculation)
Javelin-confirmed (separate basis)
- Confirmed chain share (lower bound): Taipei 6.2%, New Taipei 4.7%, Yilan 2.3%
Google Maps (venues and ratings)
- Venues: Taipei 30,345, New Taipei 35,050, Yilan 5,923
- Average rating: Taipei 4.23 (27,739 rated), New Taipei 4.22 (32,336), Yilan 4.38 (5,334)
Six things worth noticing
1. New Taipei has the most Google listings but fewer tax-registered operating venues than Taipei. 35,050 against 30,345 on Google, 24,596 against 25,811 in tax records. That is 1.43 Google listings per tax-registered operating venue in New Taipei, 1.18 in Taipei and 1.34 in Yilan. I would not read this as a difference in market structure: the two sets are different populations (per Javelin's definitions, tax records include delivery-only and stall businesses; Google listings include temporarily closed venues), and Javelin is still expanding coverage: it publishes 421, 696 and 80 expansion records (not new shops) in 24 hours for Taipei, New Taipei and Yilan, and New Taipei's daily addition is about 2% of its venue count, so the ratio keeps moving. I use tax records to compare size because their basis is the most consistent across the three, but they have limits too, such as registration not meaning active trading.
2. New Taipei registered more new businesses than Taipei in 12 months. It has 1,215 fewer operating tax records than Taipei but 495 more new registrations. The new share, 10.2% against 7.8%, is the proportion of currently operating venues that registered in the last 12 months. It is not a growth rate because closed new venues are not in the denominator, but it shows how fast newcomers are arriving. The spread within New Taipei is wide too: among districts with 300+ operating records, Xizhi 17.2% (1,438 records) against Ruifang 5.1% (350), a factor of 3.4. A registration is not a confirmed open shop.
3. Yilan rates highest, but this article cannot say why. 4.38 against 4.23 in Taipei and 4.22 in New Taipei, about 0.15 higher. Rated venues are about nine in ten in all three (Yilan 90.1%, Taipei 91.4%, New Taipei 92.3%), so the gap is not caused by many unrated venues. All 12 Yilan towns average between 4.33 and 4.48, every one above Taipei's best district (Daan, 4.31); but some small New Taipei districts are also high (up to 4.46, from only 21 venues), and Yilan's top town, Datong at 4.48, has only 28, so small samples tend to read high. Possible causes include different reviewer groups, venue density or competition; Javelin's data cannot separate them, so please do not read it as "Yilan's restaurants are better".
4. Taipei has the highest confirmed chain share, Yilan the lowest. 6.2%, 4.7% and 2.3%. This is the share of chains Javelin can verify, a lower bound, and the completeness of evidence may differ by county, so use it only for direction; the gap itself is small (6.2% against 4.7%), and most venues in all three counties are not confirmed chains.
5. Top-three district share: relatively concentrated in New Taipei, highest in absolute terms in Yilan. Taipei's top three districts hold 40.0% of its Google venues, New Taipei's 35.4% and Yilan's top three towns 61.0%. But the counties have 12, 29 and 12 districts, so these cannot be compared directly: an even split would give 25%, 10.3% and 25%, making Taipei's top three 1.6 times the even-split level, New Taipei's 3.4 times and Yilan's 2.4 times. The multiple is the top-three share divided by the even-split level (3 divided by the number of districts), a simple method that is inflated when there are many small districts, so read it as direction only: New Taipei is relatively concentrated in Banqiao, Xinzhuang and Sanchong. Yilan's absolute 61.0% is the highest.
6. The top search category differs. See below.
Where competition and new openings are highest
Competition scores are relative within each county or city, so only same-county rankings are compared:
- Taipei: Daan 88, Zhongshan 75, Datong 71; highest new share Neihu 9.2%. See Which Taipei District Is the Most Competitive? (15 October data version).
- New Taipei: Banqiao 81, Yonghe 76, Linkou 74; highest new share Xizhi 17.2%. See Most Competitive New Taipei District for Restaurants.
- Yilan: Jiaoxi 78, Yilan City 67, Luodong 66; among towns with 300+ operating venues the highest new share is Jiaoxi at 10.5%.
Search interest: coffee in Taipei and Yilan, bubble tea in New Taipei
Javelin shows the hottest food categories in Google Trends over the last four weeks (data updated 2026-10-23):
- Taipei: coffee (index 147), then hot pot 55, breakfast 52, yakiniku 46, beef noodles 32
- New Taipei: bubble tea (index 443, a multiple of the "food" baseline, not 1.7 times coffee's real search volume), then coffee 257, hot pot 119, breakfast 88, yakiniku 58
- Yilan: coffee (index 53), then breakfast 25, hot pot 18, snacks 8, beef noodles 8
Limits first: these are relative indices, not search counts; the baselines differ (Taipei and New Taipei use "food" as 100, Yilan uses "Yilan food" as 100 because Google has no county-level data); and New Taipei and Yilan have small volumes with incomplete weekly data, so growth percentages are unreliable. The category lists may also differ by county: Taipei's top eight do not include bubble tea, and I cannot tell whether it is untracked or just lower. Compare category rank within a county only, never 443 against 147.
Reading it correctly
- Tax records, Javelin-confirmed figures and Google listings are different bases and cannot be subtracted from each other. I use tax records for size and Google ratings for reputation, and each has limits.
- New registrations are not net growth; the new share is based on currently operating venues.
- The chain share is a lower bound and evidence completeness may differ by county.
- Competition scores and search indices are relative within each county or city.
- This is a 24 October 2026 snapshot. Javelin imports data batches daily and re-confirms individual venues on a rotating schedule, so figures will change.
What to do with it
- Suppliers and sales teams: New Taipei has the most new registrations in 12 months (2,515) at the highest share (10.2%), so put it first on a prospecting list; Taipei has a lower share but still 2,020; about two thirds of Yilan's 392 are in Jiaoxi, Yilan City and Luodong. A registration is not a confirmed open shop, so verify the list.
- Founders: New Taipei's districts differ widely in new share, so look at the specific district you plan to enter, and remember that a high share can mean opportunity or intensifying competition, so read it with the competition score; Yilan's average rating is high overall, so compare a venue's reputation within its own district, not across counties.
- Chains: Yilan and New Taipei have lower confirmed chain shares, but that may reflect smaller demand or less evidence rather than a gap, so check foot traffic and per-store revenue before expanding.
FAQ
How many restaurants are there in Taipei, New Taipei and Yilan? Javelin tracks 71,318: Taipei 30,345, New Taipei 35,050 and Yilan 5,923 (Google Maps listings not permanently closed, including temporarily closed; data version 24 October 2026; coverage still expanding).
Which county has the most restaurants? It depends on the basis. New Taipei has the most Google listings (35,050); Taipei has the most tax-registered operating records (25,811). Because Google coverage is still expanding, I suggest tax records to compare size.
Which county registered the most new restaurants in the last year? New Taipei, with 2,515 new tax registrations in 12 months (2025-11 to 2026-10) against 2,020 in Taipei and 392 in Yilan. Its new share, 10.2%, is also the highest.
Which county has the highest chain share? Taipei at 6.2% (confirmed, lower bound), then New Taipei 4.7% and Yilan 2.3%.
Why are Yilan's restaurant ratings higher? This article cannot say. All 12 Yilan towns average between 4.33 and 4.48, above Taipei's best district, but Javelin's data cannot explain the gap.
Try it yourself
For the earlier Taipei and Yilan comparison (15 October version) see Taipei vs Yilan: A Restaurant Market 5 Times Larger. Switch counties in the Javelin market overview to see county KPIs, competition and search interest for free; district insight and new-store radar show district details. Product details are on the Javelin page.
Sources
- Ministry of Finance business-tax records, Google Maps and Google Trends, integrated by Javelin (data version 2026-10-24; Trends updated 2026-10-23)
- Javelin's New Taipei county card shows 35,049 venues while its FAQ and district sum give 35,050 (I use 35,050); its Yilan trend chart labels coffee 54 while the table shows 53 (I use 53)
- Operating venues, 12-month new registrations, chain share (lower bound), venue counts and ratings are Javelin public-page figures; new shares, ratios between sources, top-three concentration multiples and rated-venue coverage are the author's calculations from them
- Search indices are Google Trends relative values, not search counts; baselines differ by county, for comparison within a county only