Talks & Corporate Training
Real-world enterprise analytics turned into methods your team can use: clean the numbers, pick the right chart, work with AI and write the conclusion — so every chart is understood in seconds and drives action.
Independent Consultant & Corporate TrainerAvailable for consulting and in-house trainingUpcoming talk
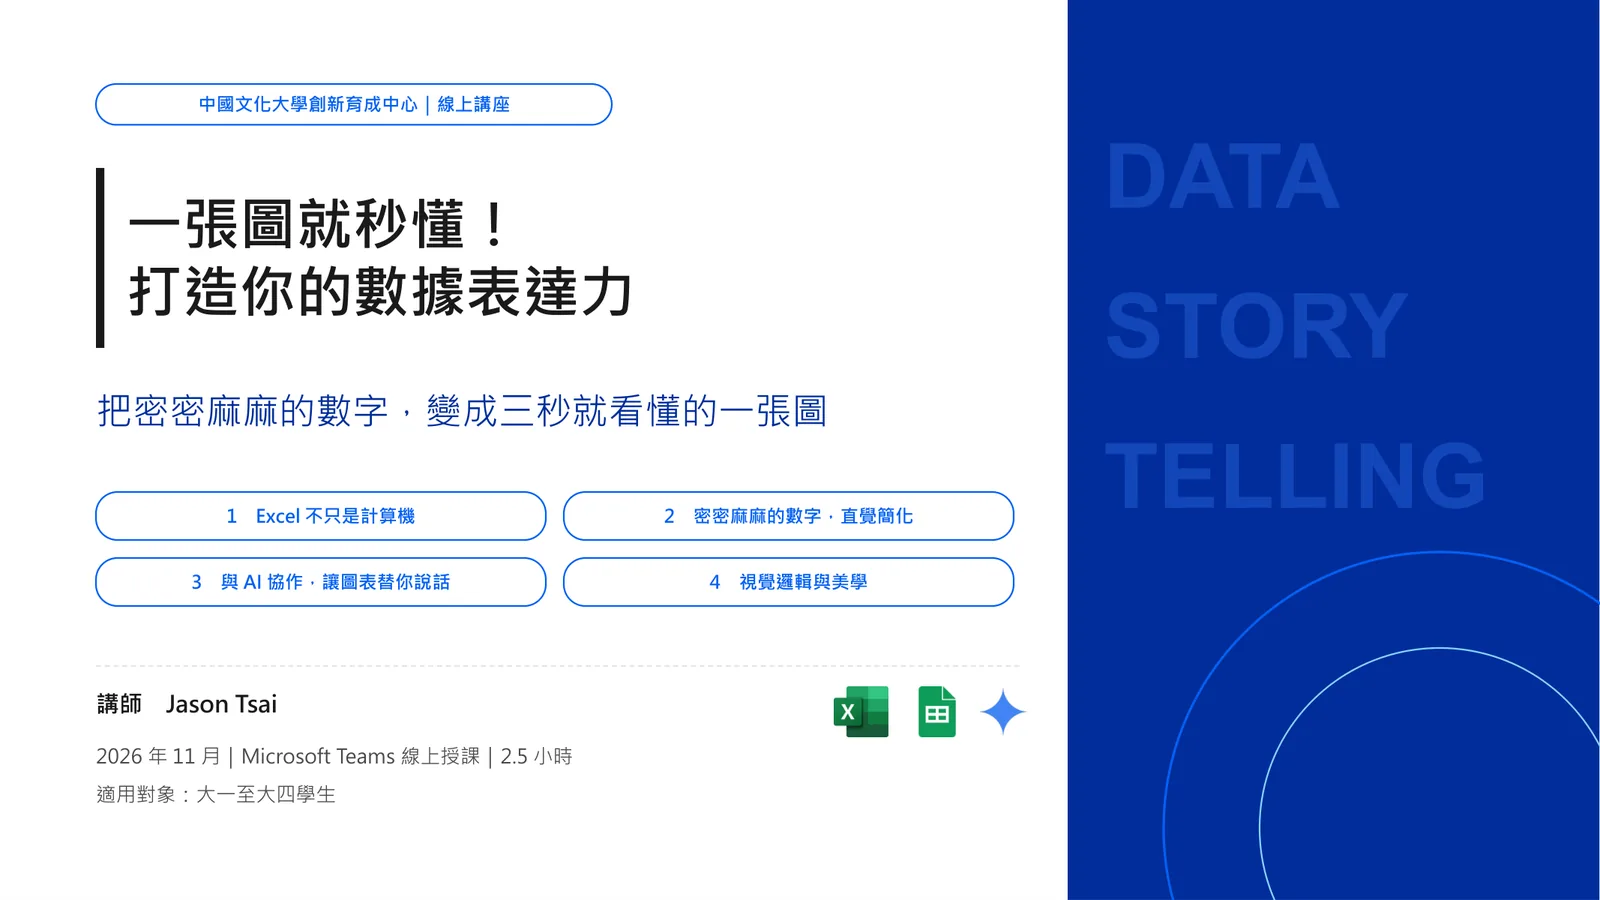

Get It in One Chart: Building Your Data Storytelling Skills
Turn dense numbers into a chart people understand in three seconds
- Date
- Wed, 18 November 2026
- Format
- Online via Microsoft Teams | 2.5 hours
- Host
- Chinese Culture University Innovation Incubation Center
- Audience
- Undergraduate students
This is an on-campus talk without public registration. Interested in a session for your school or company? Get in touch.
Course summary
Structured around the six lessons of "Storytelling with Data" and built hands-on in Excel and Google Sheets with open data from 369 YouBike stations across Taipei’s 12 districts.
Part 1 | Excel is more than a calculator
- Workflow: clean, calculate, chart, then conclude
- Clean and summarise with TRIM, COUNTIF, SUMIF and XLOOKUP
- Choose charts by purpose: sorted bar and tornado charts
- Start bar axes at zero so gaps are not exaggerated
Part 2 | Simplify dense numbers
- Five decluttering steps for default charts
- Colour-scale heat maps that reveal hotspots instantly
- Titles that state the conclusion, not the topic
- One highlighted series and SPC charts to spot real anomalies
Part 3 | Let AI help your charts speak
- What Copilot and Gemini can do in spreadsheets
- SCR prompting: situation, complication, request
- Three ways to verify AI-written formulas and insights
- What data you should and should not share with AI
Part 4 | Visual logic and design
- Colour for emphasis and grouping, not decoration
- Three type levels and one point per slide
- Combining key charts into a one-page dashboard
- A 7-point checklist before you hand it in
Plus a 10-minute opening, 15-minute break and 10-minute wrap-up, with three 5-minute hands-on exercises.
Four things participants take away
Choose
Pick charts by comparison, trend, composition or relationship
Declutter
Remove noise so the point stands out
Conclude
Let the title tell the audience what to think
Verify
Always check AI-generated formulas and numbers
Course preview
Six selected slides (in Chinese). The full deck is provided to participants only.
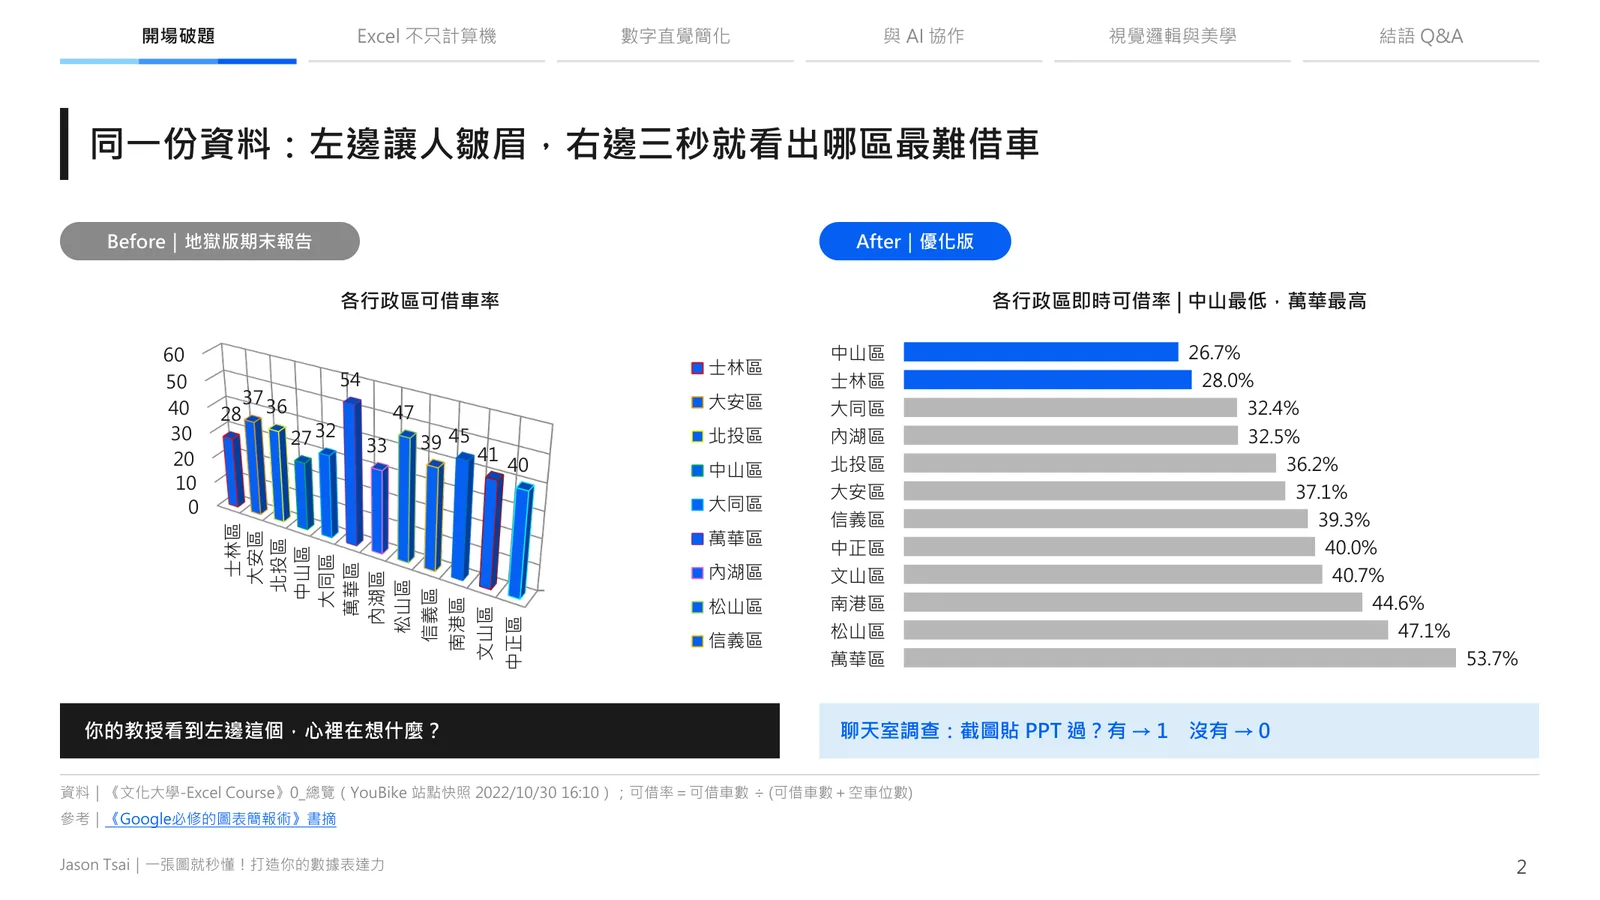
Same data: one chart confuses, the other shows the hardest district to rent a bike in seconds
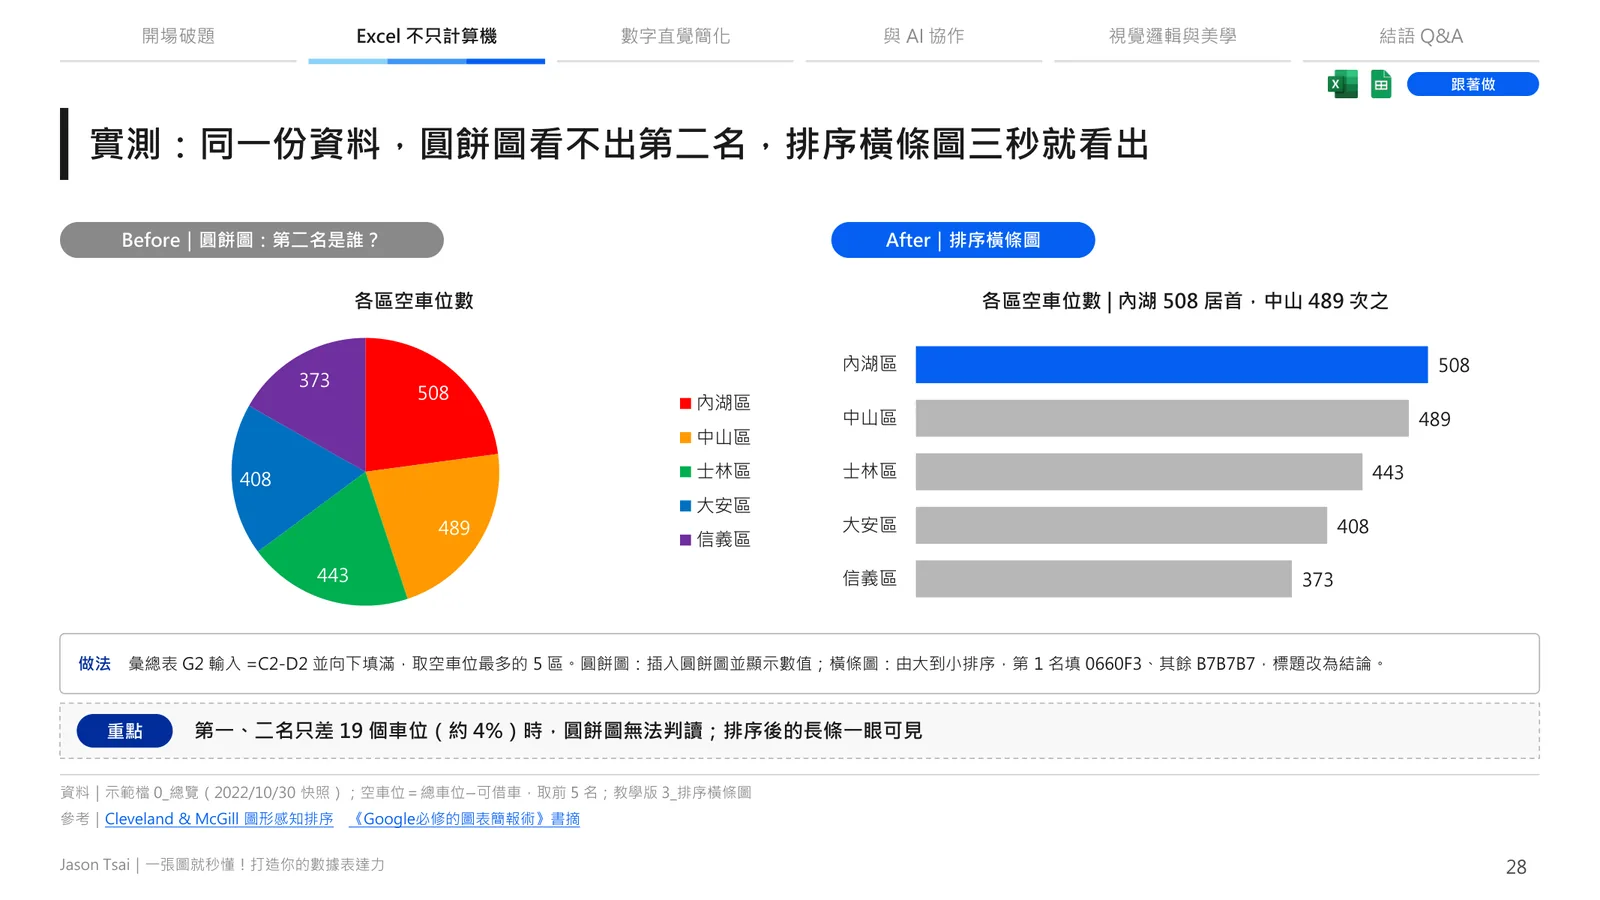
A pie chart hides second place; a sorted bar chart shows it instantly
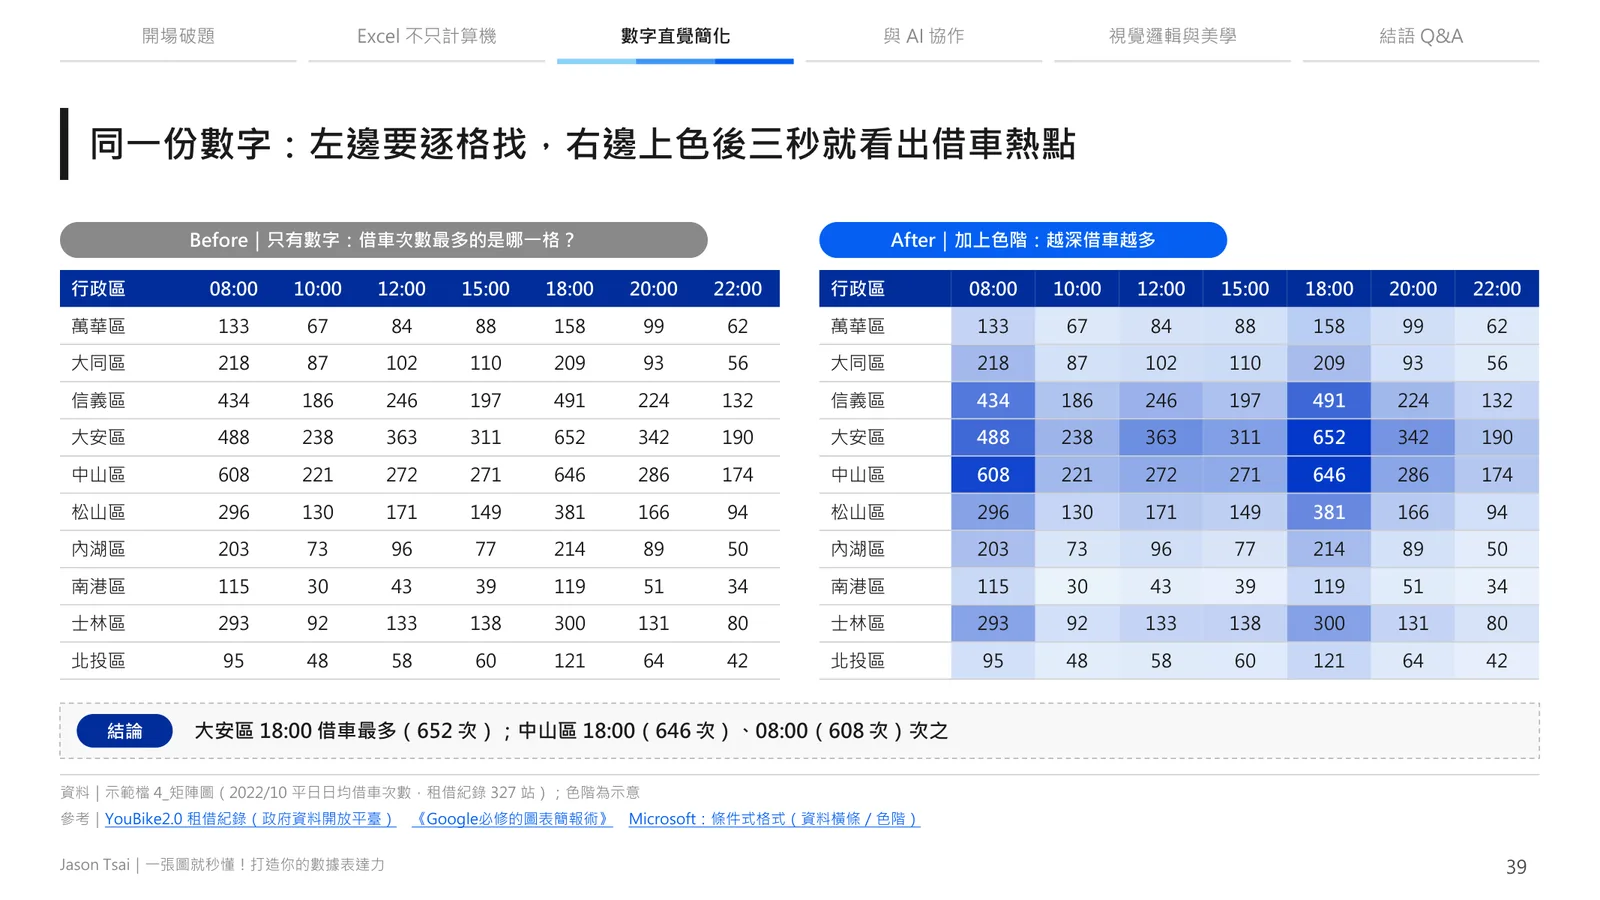
Colour turns a wall of numbers into visible hotspots
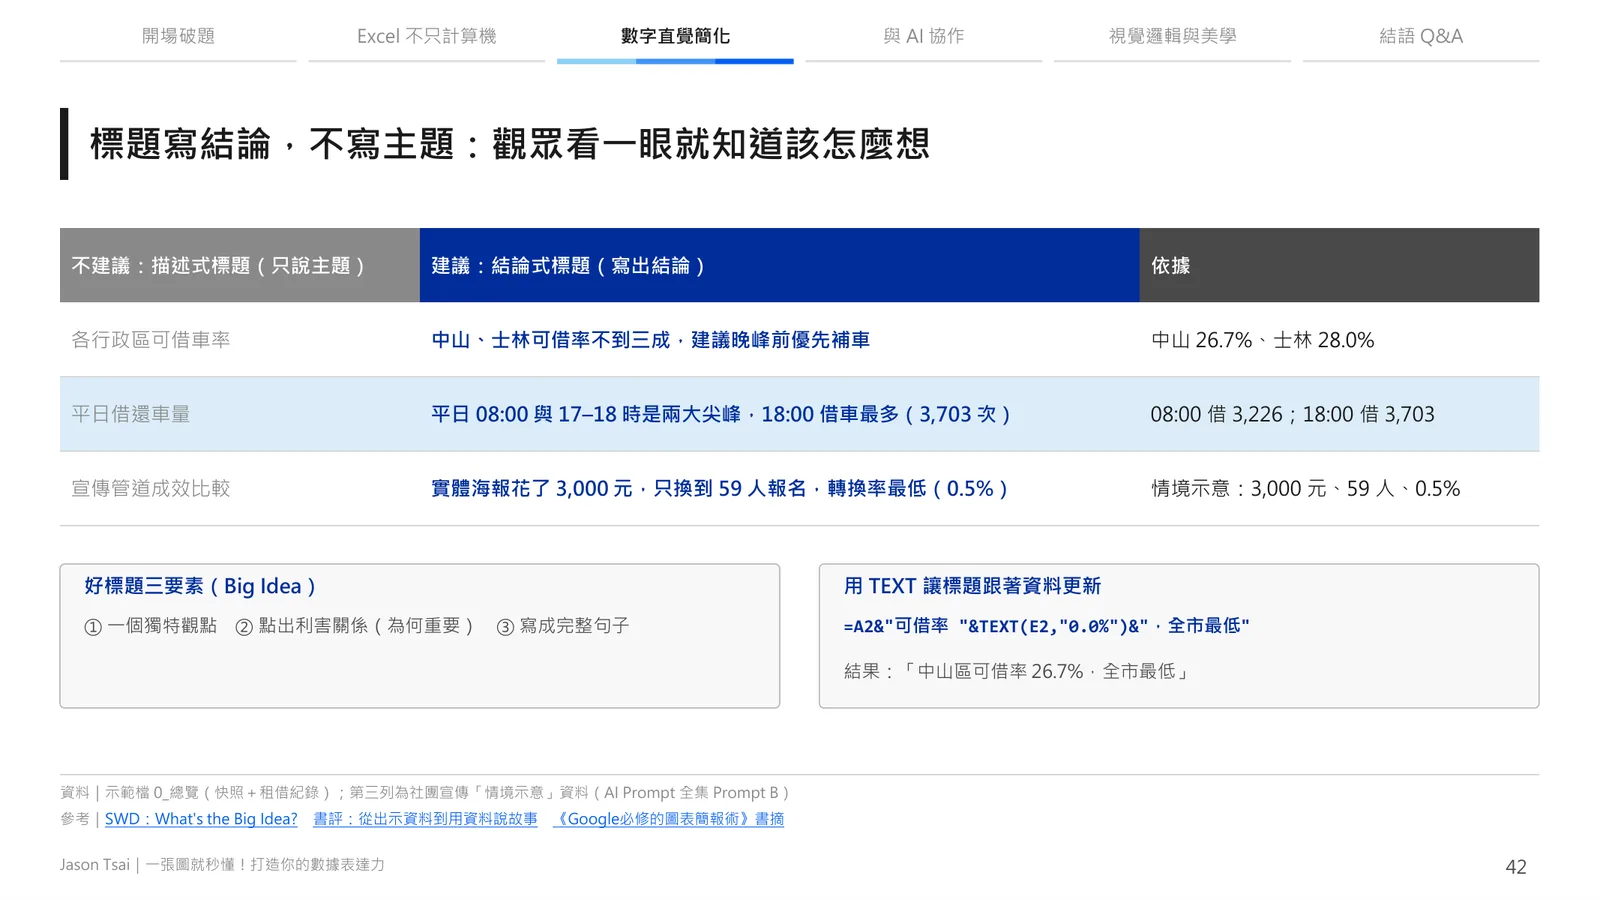
Titles that state conclusions, not topics
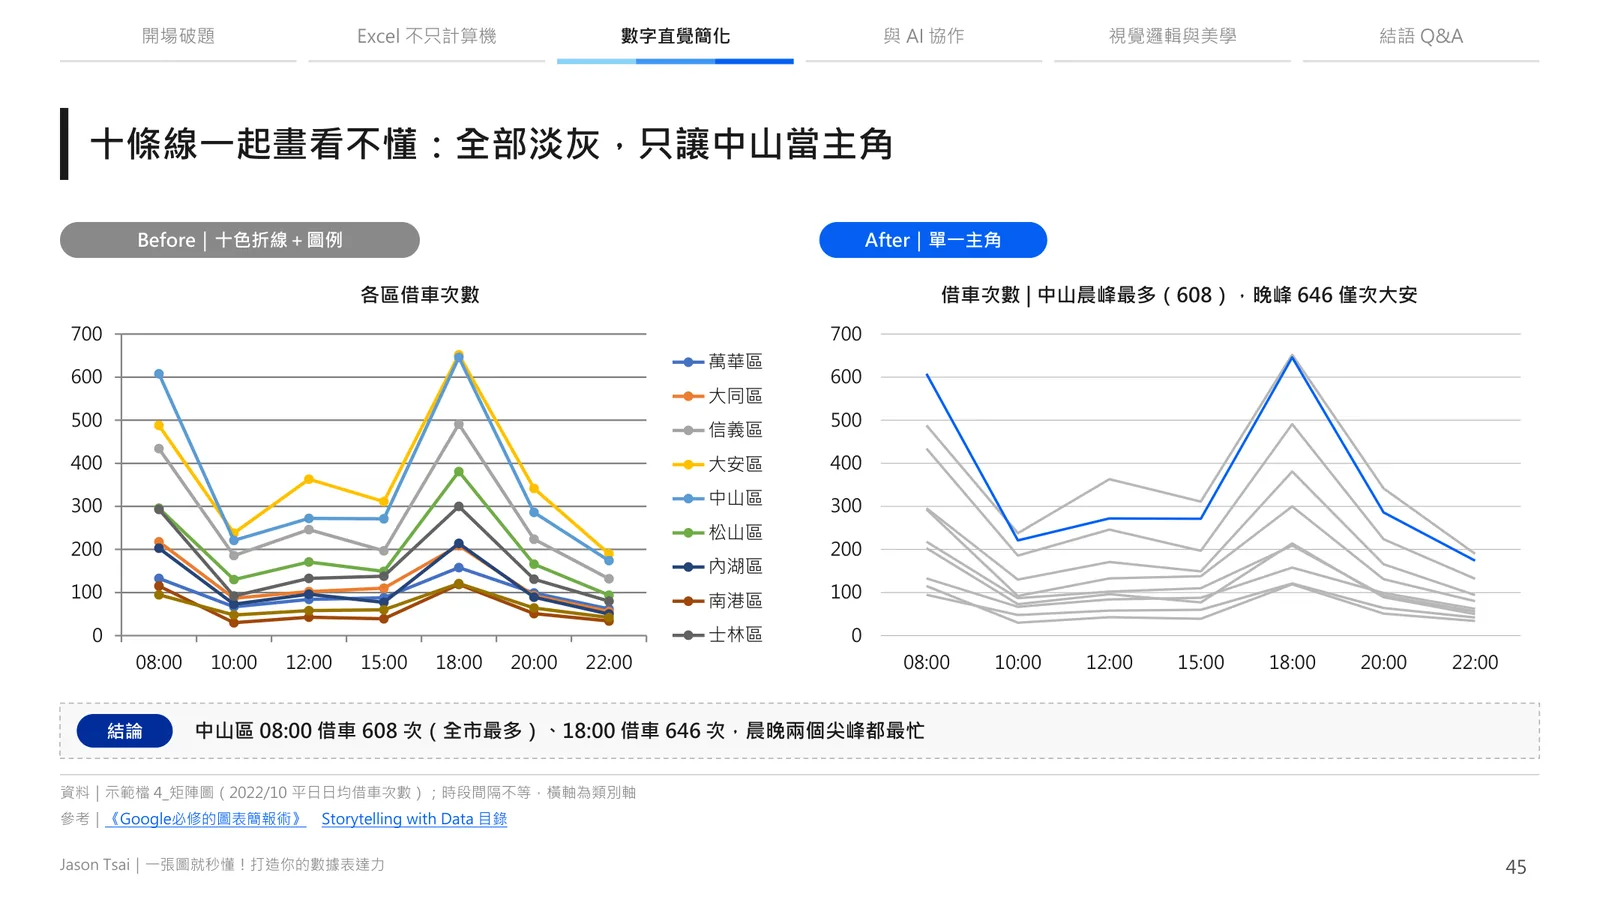
Ten lines are unreadable — grey them out and highlight one
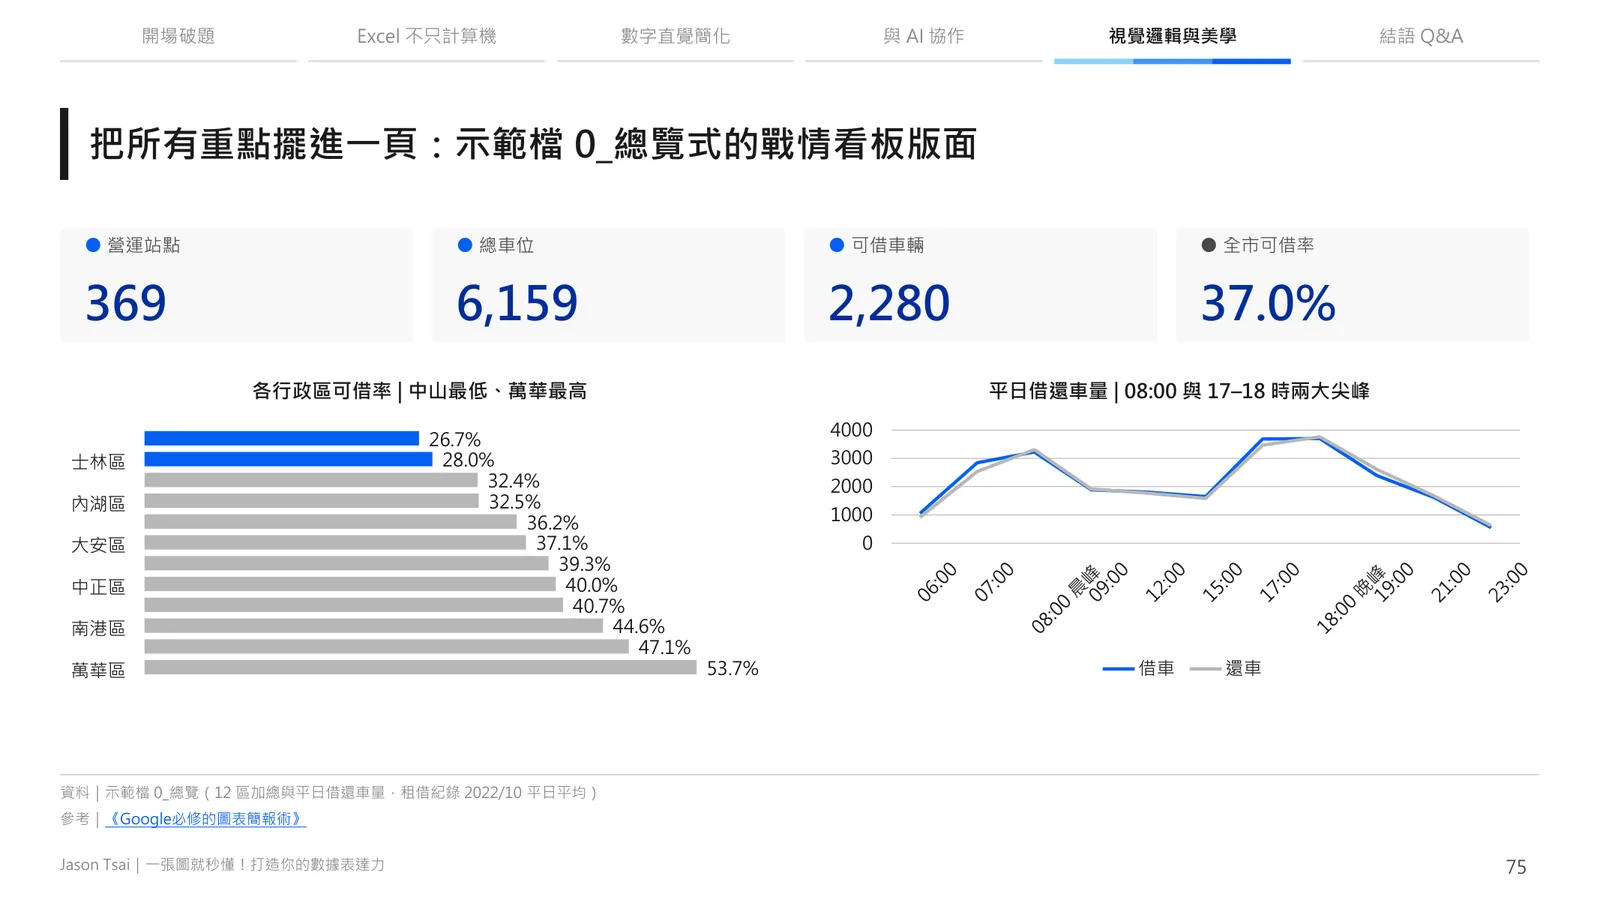
Everything on one page: a dashboard layout
After the talk: Excel practice workbook
The workbook used in the session, for following along step by step. Available after the talk — register now to receive it.
What participants say
Excerpts from anonymous post-session surveys.
I went from never touching Tableau to building a report — hugely rewarding. The delivery and demos were so clear that no one ever felt lost.
Funny, crystal-clear and perfectly on time — the first time I’ve seen a class this well-paced and this well-taught.
The case studies on building a CDP and digital-behaviour customer tags showed me exactly what MarTech teams do in industry.
The most valuable part was the generous self-study resources and the skills-spectrum analysis — the “go deep, then broad” advice is very practical.
He explained the analytics workflow in such an accessible way that it never felt intimidating — I learned a lot.
From the Tableau basics at the start to the more advanced techniques later on, everything was taught in detail. Thank you, Jason!
Translated from the original Chinese feedback.
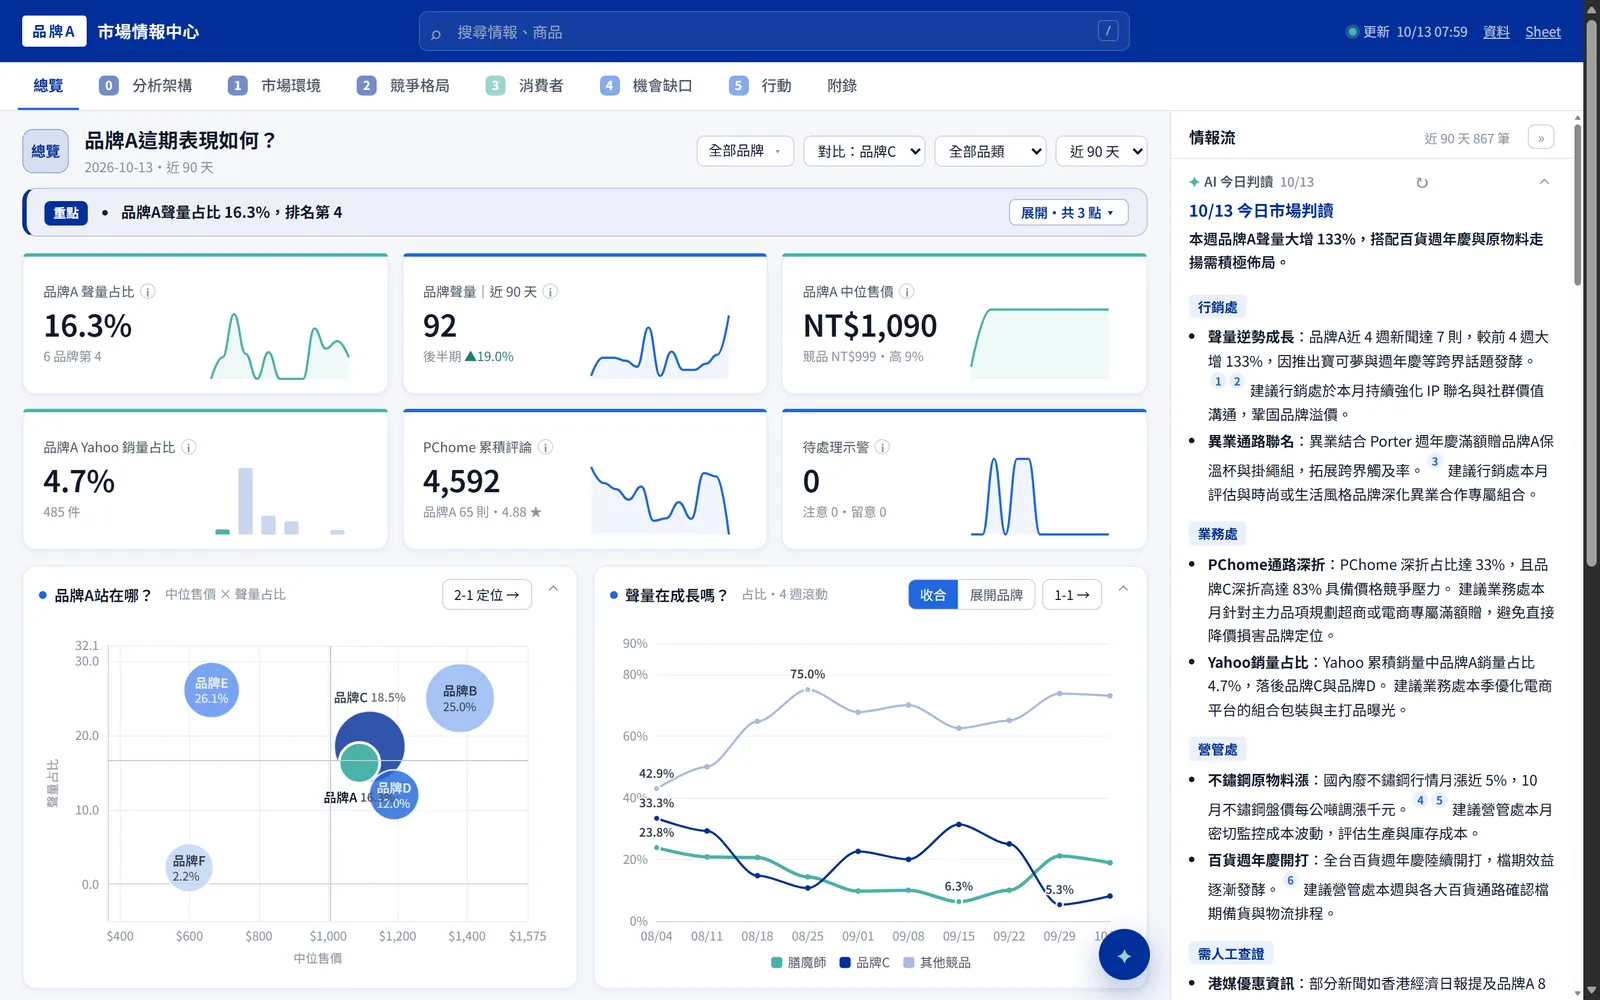
Corporate training plans
One method, adapted to your team’s level and goals. Reference prices (excl. tax); final quotes depend on headcount, customisation and location.
Talk
2–2.5 hours
From NT$20,000
Company-wide awareness, study groups, team sharing
- Methods and live demos
- Any group size, online or on-site
- Condensed handout
Half-day workshop
3 hours
From NT$36,000
Teams who need to produce charts and reports
- Talk content plus 2–3 hands-on exercises
- Excel / Google Sheets practice workbook
- Up to about 40 participants
Full-day program
6 hours
From NT$68,000
Analytics, marketing and sales teams with regular reporting
- Pre-training needs interview and custom cases
- Full hands-on practice plus AI collaboration
- One follow-up online Q&A
- Up to about 30 participants
Schools and government agencies follow their own speaker-fee standards. On-site sessions outside Taipei include travel costs.
Available topics
Data storytelling
Data prep, chart choice and decluttering in Excel / Google Sheets
Tableau visualization
A complete beginner-to-practitioner course with 300+ teaching hours
AI tools at work
NotebookLM, Gemini and Copilot for analysis
CRM & MarTech data
Data collection and use with GA4, CDPs and Salesforce

Trainer
Jason Tsai, independent consultant and corporate trainer. Former Senior Solution Engineer at Salesforce and Data Analyst (Assistant Manager) at Cathay Life Insurance; Tableau instructor at Lien Cheng Computer with 300+ teaching hours and 150+ trainees, also teaching at nSchool, Infinite Academy and X Platform.
Full experienceCorporate x University Club Projects
While at Cathay Life, I served as the business owner and mentor for two consecutive cohorts of student teams at NTU and NCCU data clubs, practising the full path from problem definition to modelling and recommendations on real business questions.
NTU Data Analytics Club (NTU DAC)
- 2025
Machine-learning team: a predictive model to lift EDM performance and conversion. Business-analysis team: purchase sequences and digital behaviour of household customers across life stages.
- 2026
Business-analysis and machine-learning teams: raising adoption of online policy loans, with a supporting dashboard and a demo video.
NCCU Data Analytics Club (NCCU DA)
- 2025
Martech project: studying diverse visitors’ entry behaviour and modelling the best conversion paths.
- 2025–26
Second-year collaboration, with the corporate project alignment meeting held in December 2025 for the new cohort.
My role:Briefing and requirement interviews, mid-term and final reviews, monthly mentor meetings, evaluation and feedback.
Only public-level highlights are shown; no internal company data is included.
Talks & teaching
Regularly invited by university clubs and institutions to speak on Tableau, data visualization, MarTech and data careers, and teaching on Lien Cheng Computer (Rookie Savior), nSchool and Infinite Academy.
- 2026.11Get It in One Chart: Data StorytellingChinese Culture University Innovation Incubation CenterUpcoming
- 2025.09A Guide to Data Analytics Careers (7th-term career session)NTU Data Analytics Club (NTU DAC)
- 2025.08Tableau courseNCCU Data Analytics Club
- 2025.03Data careers: portfolios, interviews and MarTech in practiceNational Taipei University of Business
- 2025.03Practical Statistical ModelsNCCU Data Analytics Club
- 2024.12Judge, final presentations of corporate projectsNCCU Data Analytics Club
- 2024.11Tableau Basic and Advance workshops (two sessions)NCCU Data Analytics Club
- 2024.10Tableau Workshop (two sessions)NTU S&C Marketing Club
- 2024.09A Guide to Data Analytics Careers (6th-term career session)NTU Data Analytics Club (NTU DAC)
- 2024.05MarTech: Applications and InnovationNTU Data Analytics Club (NTU DAC)
- 2024.03Data career panel discussionNTU Data Analytics Club (NTU DAC)
- 2023.04Tableau in PracticeNTHU Consulting Group
- 2024.03Tableau Workshop (two sessions)NTU S&C Marketing Club
- 2023.03Tableau courseNTU S&C Marketing Club
- 2022.11Tableau in PracticeGoogle Developer Student Clubs, NYCU
FAQ
Can sessions be online?
Yes. Talks and workshops run on Microsoft Teams, Google Meet or Zoom, with practice files for the hands-on parts.
Do participants need Excel experience?
Basic skills (entering data, inserting a chart) are enough. Functions and AI collaboration are demonstrated from examples.
Can we use our own data?
For the full-day program, cases are designed after a needs interview using anonymised or simulated data from your context — no real personal data needed.
Planning a session for your team?
Share your team size, level and the problem you want to solve. I will reply within two business days with a recommended plan and quote.
Enquire