2026-10-13
ChartBar Explained | Taiwan's Life Insurance Market Map: Premiums vs. Benefits of the Top 5 Insurers (2021)
Adapted from an August 2022 ChartBar Instagram post (61 likes, 13 saves), with added industry context. The author previously worked at Cathay Life Insurance; this article uses only public government data.
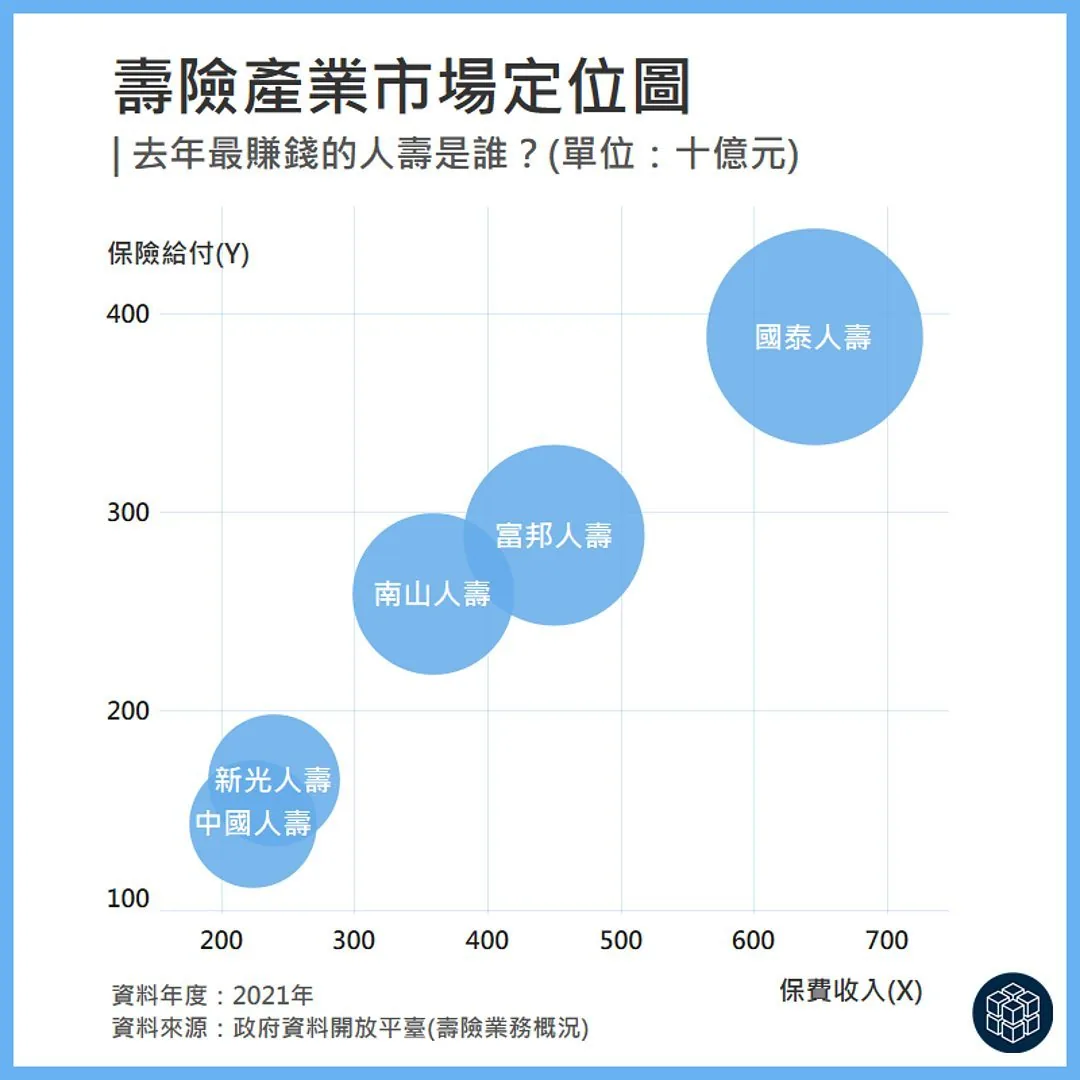
Key findings
The x-axis shows premium income and the y-axis benefit payments (NT$ billions). Figures below are approximate readings from the chart:
- Cathay Life leads on both axes: roughly NT$640 billion in premiums and NT$390 billion in benefits.
- Fubon Life (~NT$450 billion) and Nan Shan Life (~NT$360 billion) form the second tier.
- Shin Kong Life and China Life sit close together at around NT$220–240 billion.
- All five insurers fall below the "benefits = premiums" line, meaning net cash inflow for the year.
Reading it correctly
The original post framed this as "which insurer made the most money" — but premiums minus benefits is not profit:
- Most premium income is set aside as policy reserves — a liability owed to policyholders, not earnings.
- Benefits include maturity, surrender and annuity payments on policies sold years earlier, so they reflect the age and mix of the book rather than current performance.
- Life insurers earn profit from three spreads — investment spread, mortality spread and expense spread — with investment returns usually dominating.
So the chart shows market scale and cash flow. To compare profitability, look at net income, ROE or investment yield instead.
Why this chart design
A bubble chart (positioning map) compares two measures at once and labels each bubble directly, so no legend is needed. If redesigned, a y = x reference line would make the cash-flow reading explicit, and transparency or data labels would fix the overlap between Shin Kong and China Life.
Source: Taiwan Government Open Data Platform (life insurance business overview), 2021. Made with Tableau. Values are approximate chart readings.